
Transforming Traffic Data Into Road Safety
How HOA’s, Law Enforcement, and City Planners Can Use
Traffic Data to Save Lives and Improve Their Cities
As someone involved in creating safer streets in your community, questions like “Where should we send law enforcement officers on patrol?” “Where do we need to install new traffic calming devices?” and “How do we make the best use of our limited time and budget resources?” can be difficult to answer.
Unless you are content with just guessing or going with a “gut feeling” about your city’s traffic safety problems, you will need to collect high-quality data and understand how to translate it into useful, actionable information.
Who Needs Traffic Data
Municipalities
Creating and maintaining safe, livable cities involves many factors. The proper traffic data informs you about which roads may need to be widened, which streets in your city may be most vulnerable to weather-related problems, and can even give you clues as to how frequently you will need to maintain your busy roadways.
You also may need to direct traffic during road construction, post flashing “Your Speed” signs in areas where there are sudden speed limit changes, or warn drivers about roadways that flood on a frequent basis.
HOAs
The purpose of a Homeowner’s Association is to improve the neighborhood. Of course, this involves a focus on making common areas beautiful, maintaining property values, and fostering a strong sense of community.
It can also involve keeping residents safe by ensuring that people are driving at a reasonable speed- especially in areas where children are present.
Combining speed feedback signs with radar data collection for authorities is the perfect solution.
Law Enforcement
With resources stretched thinner than ever, law enforcement agencies need to be sure that they are utilizing their officers efficiently and effectively.
When it comes to speed enforcement, having the data that enables you to be at the right location on the right day at the right time to make the biggest impact on safety is critical.
The Right Data For The Right Application
It is critical that you collect the right data to fully inform your traffic safety project decisions. Collect the wrong data, and you may waste your budget funding ineffective solutions that don’t actually solve your problems. Collect data that is too broad, and you can create confusion and overwhelm without.
Data Sets and Their Usage

Traffic Count
Traffic count is simply the number of vehicles that pass a certain point within a given time period.
Questions That Can Be Answered with This Information
Do we need to widen this road because it receives too much traffic? What percentage of our highway traffic is due to residents vs. tourists? Can we show that there is enough demand for the proposed highway extension project? Do a lot of people cut through our neighborhood who don’t actually live here?
Time of Day
While knowing where people are speeding is half the battle, it is also just as important to know when they are more likely to be speeding.
Questions That Can Be Answered with This Information
Are people driving with excessive speeds when there isn’t as much traffic on this road? What time of day should crews work on our road construction project to be least disruptive to commuters? Are there many speeders in this school zone during traffic calming periods that create dangerous situations for children crossing the road? What hours should our zip lane change traffic in this lane from north-bound to south-bound?
When and Where
Knowing where and when vehicles are speeding in your city is critical for knowing where to send traffic enforcement units, where to install traffic calming measures, and where speed limits may need to be modified over time.
Questions That Can Be Answered with This Information
Where should we place a more visible law enforcement presence in order to slow down traffic? Where are speed-related accidents more likely to occur during inclement weather? Where are areas of our city that are least safe for pedestrians? Are people speeding through neighborhoods to avoid traffic jams on other thoroughfares?
Speed Reduction
Radar speed signs like our PMG have the ability to track how fast someone is driving as they enter into a reduced speed zone and compare that to how fast they are traveling as they exit the zone.
Questions That Can Be Answered with This Information
Is my Reduce Your Speed sign placed far enough away from the crosswalk that people have enough time to slow down? Are people slowing all the way down to the slower speed limit by the time they are through the school zone, or do they only reduce their speed a little when they see the flashing speed sign?
Vehicle Classification
Knowing not just how many vehicles utilize a particular street, but also what kind of vehicles they are (cars, trucks, motorhomes, motorcycles), can give you the information you need to anticipate wear-and-tear, the speed limits you need to create enough time to fully stop the most common vehicle types on the road, and even design the most comfortable lane and shoulder widths.
Questions That Can Be Answered with This Information
Do we need to create a designated truck route through this section of the city? Are too many large vehicles driving through residential sections of our city? Do we have problems with too many speeding motorcycles on this winding section of road in our state park?
85th Percentile
Many cities and states use the 85th Percentile- or the speed at or below which 85% of all traffic travels- to determine speed limits on their roads. Understanding how this speed fluctuates on a given street depending upon weather conditions, time of day, and traffic patterns can help you create better flowing traffic and higher levels of safety.
Questions That Can Be Answered with This Information
Which of our streets have speed limits that are too slow? Where should our speed limits be increased so that we can alleviate traffic congestion during rush hour?
How To Collect The Data You Need

Now that you have a better idea of which data points you need to collect in order to make the best decisions for your streets, how do you go about actually gathering the data?
Pneumatic Road Tubes
You’ve seen these used for decades- simple air-filled tubes that activate an attached counter to determine how many vehicles drive over a particular stretch of road. While these systems are very inexpensive, they aren’t very accurate for determining vehicle classification, and also aren’t very useful when it comes to measuring speed and 85th Percentile information. Also, they are prone to breakage and vandalism.
Radar
Radar is the most frequently utilized form of traffic data collection on the market today, and for good reason. With it, you can measure not only the number of cars passing, but their speed, classification, and time of day that they pass. Data collection can be as visible or invisible as you’d like it to be, depending on the purpose of your study. The most common forms of radar data collection are:
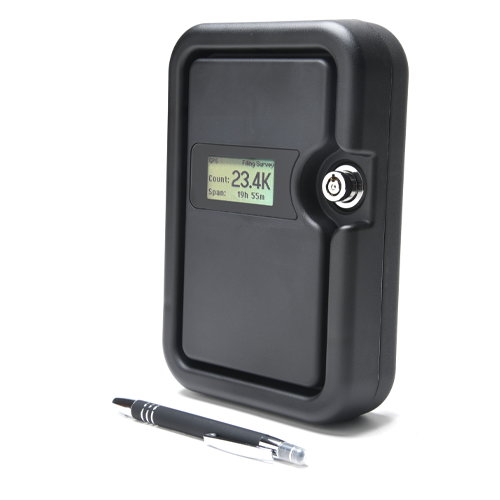
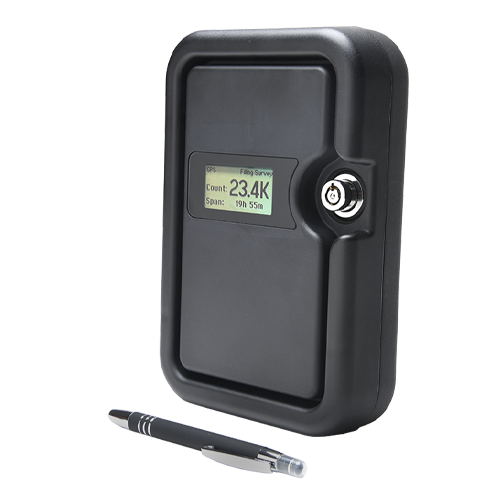
Traffic Data Collectors
Traffic data collectors, like the Street Dynamics TDC 2, that consist of a radar unit housed inside of an inconspicuous weatherproof case that is mounted near the roadway being studied.
Drivers pass right by the radar, never even realizing it was there, so data collected is most reflective of the real habits of the average driver. In addition to their low profile, they can also be quickly moved and remounted, allowing you to collect traffic data anywhere in your city.
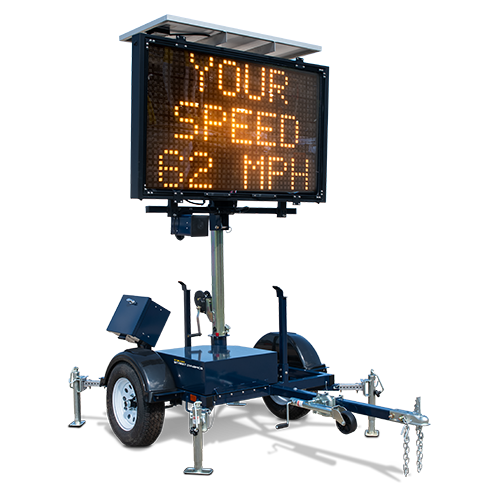
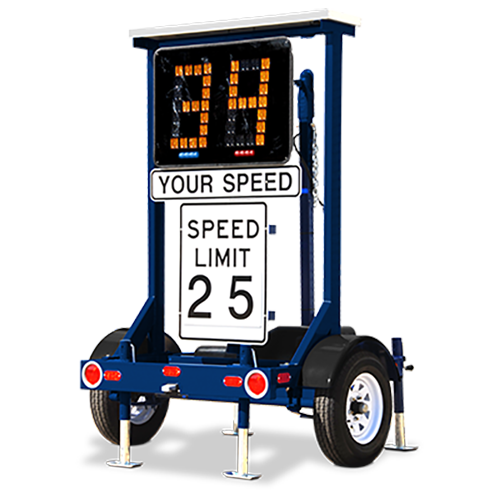
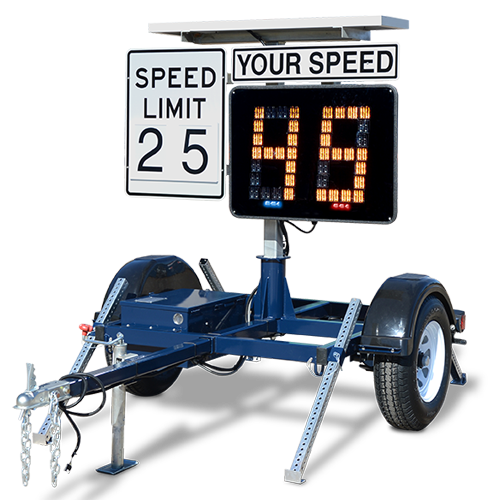
Radar Speed Trailers & Messaging Trailers
Trailer-mounted mobile variable message signs with onboard radar that give drivers feedback while also recording traffic data for later use are very useful when you are trying to change behavior in a more immediate way.
And studies have shown that people keep going slower in areas where there were speed feedback sign for at least a few days after the sign was removed.
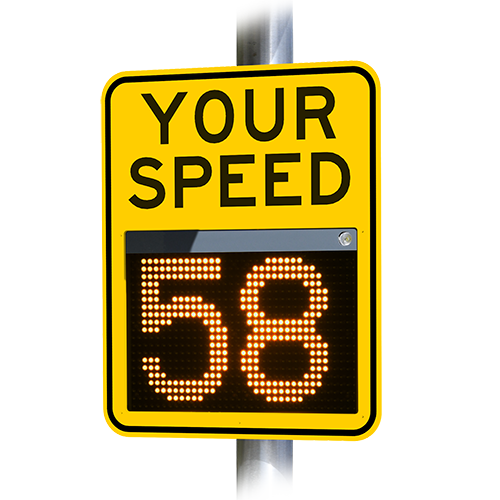
Pole-Mounted Graphic Display Signs
Similar to radar speed trailers, but affixed to a stationary pole.
These radar speed signs are generally smaller than the VMS signs on speed trailers, but can also be used to show drivers how fast they are going or display short messages.
Did you know?
Streed Dynamics manufactures all three of the preceding radar sign options, and each one of them can be paired with a solar panel so they can run indefinitely in the field. Also, some of our radar speed signs have optional wireless modules that allow you to retrieve traffic data or change the message on your sign remotely.
What To Do With Your Raw Data

Raw data, in and of itself, isn’t particularly useful for solving specific problems. While you may be able to make some guesses based on columns of numbers, converting raw data into graphics and charts is the best way to make it useable and actionable.
Not only do these charts make it easier for you to understand, but it also arms you with an effective tool for educating and influencing your decision makers.
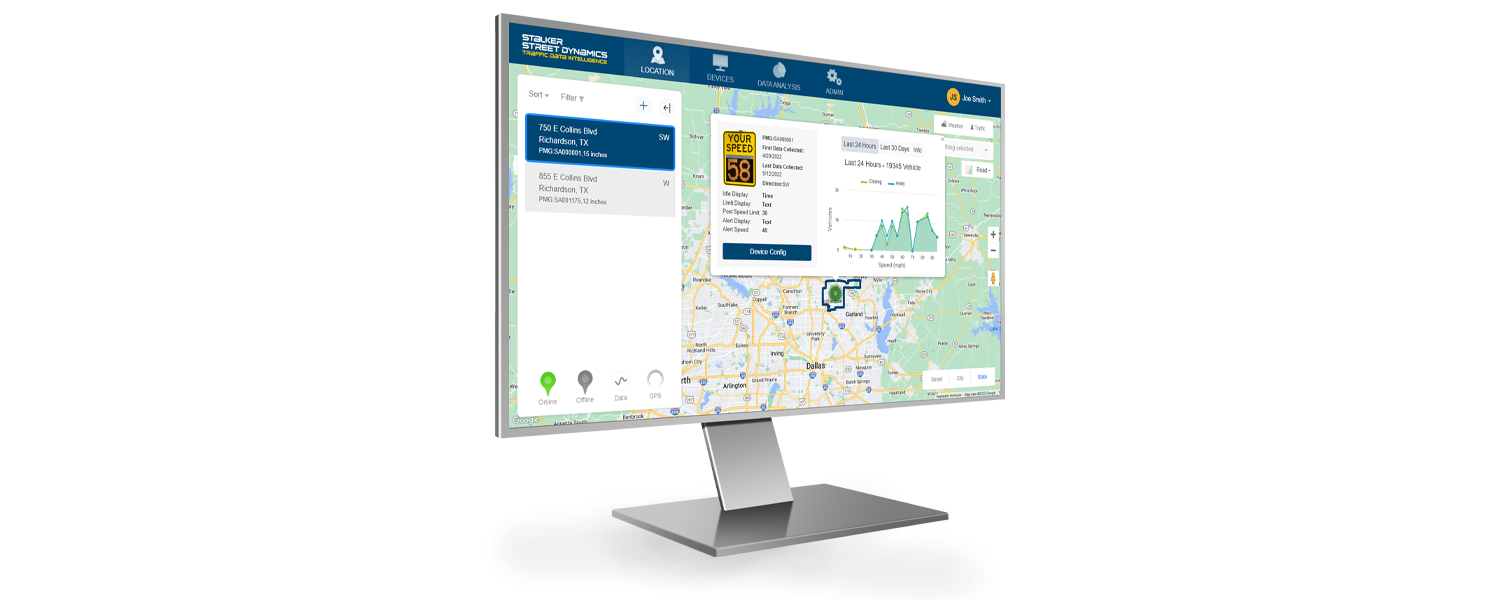
To create reports, you could plug your data into something like Excel, but the Street Dynamics Easy Analyst software that comes with our radar signs is much faster and easier. This enables you to create useful charts with just a few clicks. You can also access similar software in our Street Dynamics Web Portal if you have a connected PMG.
Types of Traffic Data Reports You Can Create For Your Stakeholders:

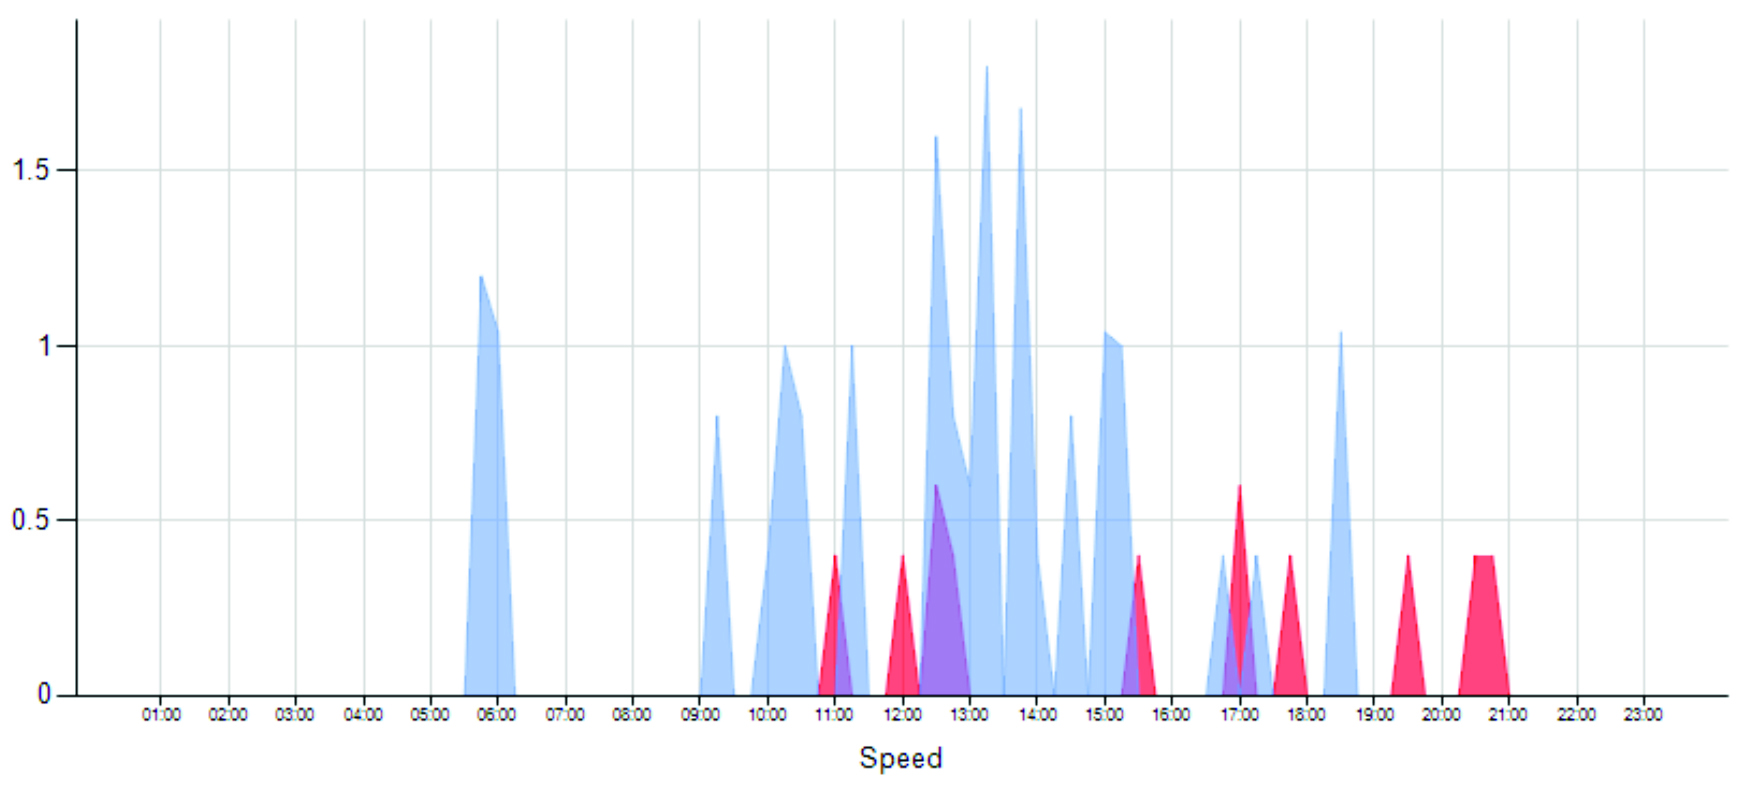
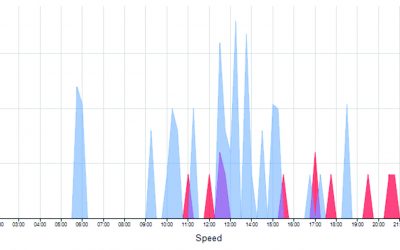
Speed vs. Time
During what hours of the day are people more likely to speed, and are they more likely to speed on any particular day(s) of the week? This report shows the date and time on the x axis and the average speed on the y axis. Showing 7 days of data on a graph gives a clear idea of weekly traffic patterns.
Use Case: Knowing when to send officers to particular locations in order to have the most influence on traffic speed.
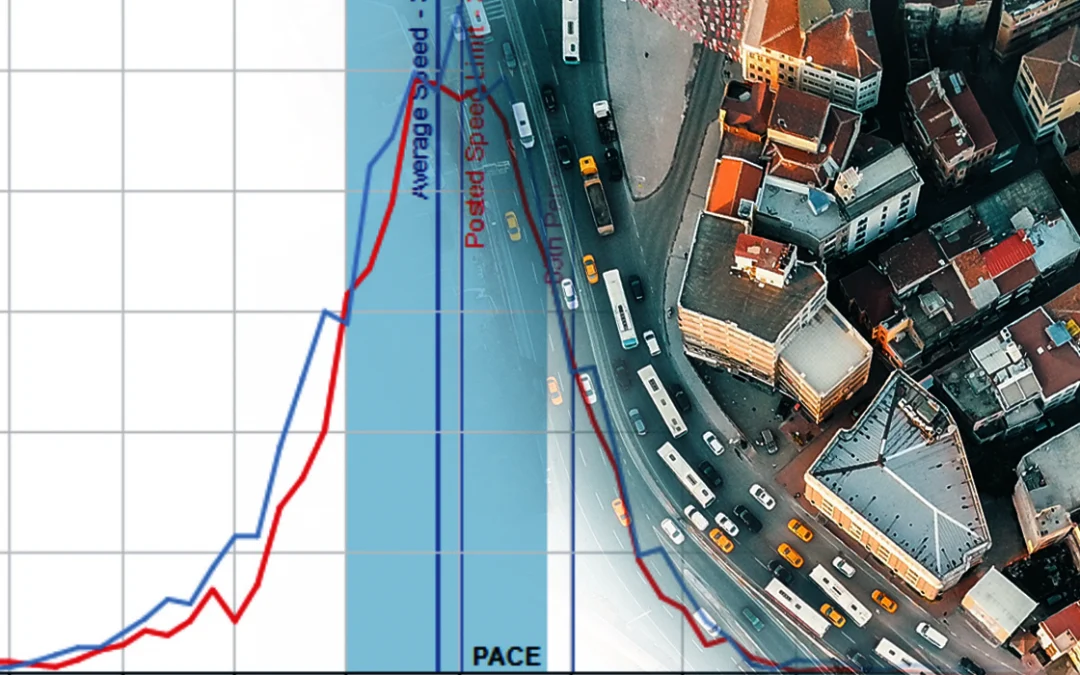
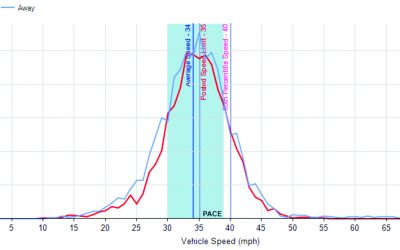
Traffic Count vs. Speed
This chart features the vehicle speed on the x axis and the total number of vehicles tracked on the y axis. If you have collected sufficient data, this chart will have a very typical “bell curve” shape, ideally with most of the traffic falling somewhere close to the posted speed.
If you notice that your bell curve centers higher than your average speed, then you know that you have a significant number of people speeding on your road.
If the bell curve is steeper, you have fewer speeders and fewer people going slower than the speed limit.
If your bell curve is flatter, then you have a wider range of speeds occurring on your road, and speed enforcement may be more appropriate for this area.
Use Case: How does the number of vehicles traveling on a particular road affect their average speed? Do a lot of people speed on this road, or is it just a few?
Percentage of Vehicles by Speed Category
What percentage of your traffic is driving at, above, or below the speed limit? What percentage of people are driving excessively above the speed limit? Generally conveyed as a pie chart, this graph makes it easy to judge the severity of your speeding problem on a particular street.
Use Case: Are many people speeding in this area, or is it just a tiny percentage of total traffic? Is this the part of town where we want to send our speed enforcement officers, or would it be better to station them elsewhere in order to create the most positive change?
Popular Use Cases

More Effective Police Presence
Use “Speed vs. Time” and “Traffic Count vs. Speed” data to pinpoint exactly when and where to send law enforcement officers to slow down hurried drivers.
Neighborhood Speeding
If you want to enable law enforcement to best support your efforts for keeping your neighborhood safe, collect “Speed vs. Time” and “Traffic Count vs. Speed” data in problem areas within your neighborhood and present it to your local precinct.
Speed Limit Increase Justification
In some areas, slowing down traffic is the goal. But perhaps increasing the speed of traffic would create safer flow on your highways. Use your Speed + Accidents information to drill down to areas that need a closer look. Most states also require evaluating roads and adjusting the speed limit to reflect the speed of the 85th percentile speed every few years.
Capital Improvements
When it comes to building, expanding, and repairing city roadways, there are a lot of stakeholders that need to be convinced in order to approve proposals. Providing them with accurate, easy-to-understand data is key to getting your city improvement projects approved.
Overlay Accident Data with Speed Data
While many accidents are related to speeding, other factors may come into play. Being able to compare the number of accidents with the average speed on a particular street can tell you if you need to introduce traffic calming measures, place permanent “Your Speed” warning signs, or if you need to focus your efforts on other factors, such as addressing blind corners, limiting right-on-red turns, or simplifying confusing intersections.
We Can Help!
Street Dynamics offers a wide variety of radar speed signs, speed trailers, stationary pole-mounted signs, and unobtrusive radar traffic data collection units that can gather the traffic data you need to make the best decisions for your citizens and your city streets. Packages can be custom-designed to meet your exact needs, and equipment can even be leased to make acquiring the equipment you want even more affordable.
Click here to speak with a Street Dynamics Representative.
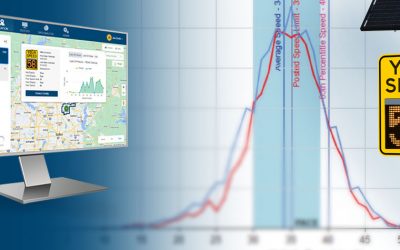
Click an image below to learn more about our Street Dynamics traffic safety products:
Ready To Learn More About Traffic Data?
Top 5 Questions Answered By Traffic Data
The decisions you make about traffic and infrastructure will have a decisive impact on your community’s safety and economy. By properly managing traffic, you can enhance safety, spend resources more efficiently, and make living in your city more enjoyable.
How To Collect Traffic Data
Long gone are the days when the best way to collect traffic data was by laying a pneumatic tube across a road. Nowadays, radar is one of the most accurate, cost effective, and reliable means of gathering the information your neighborhood or city needs.
Interpreting Traffic Data Reports
Converting raw traffic data into useful, actionable information can be a bit overwhelming if you don’t know where to start. Fortunately, Street Dynamic’s Web Portal and Easy Analyst software create charts and reports from your traffic data in just a few clicks.
More Articles from Street Dynamics
Top 5 Questions Answered By Traffic Data
The decisions you make about traffic and infrastructure will have a decisive impact on your community’s safety and economy. By properly managing traffic, you can enhance safety, spend resources more efficiently, and make living in your city more enjoyable. Here are 5 questions answered by the traffic data you collect from your streets.
Interpreting Traffic Data Reports
Converting raw traffic data into useful, actionable information can be a bit overwhelming if you don’t know where to start. Fortunately, Street Dynamic’s Web Portal and Easy Analyst software create charts and reports from your traffic data in just a few clicks.
How To Collect Traffic Data
Long gone are the days when the best way to collect traffic data was by laying a pneumatic tube across a road. Nowadays, radar is one of the most accurate, cost effective, and reliable means of gathering the information your neighborhood or city needs.