
Top 5 Questions Answered By Traffic Data
The decisions you make about traffic and infrastructure will have a decisive impact on your community’s safety and economy. By properly managing traffic, you can enhance safety, spend resources more efficiently, and make living in your city more enjoyable. Here are 5 questions answered by the traffic data you collect from your streets.
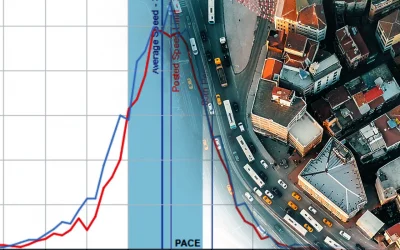
WHO are the people speeding on certain roads in our city?
The foundation of all great decisions is having solid, quality information. Whether responding to citizen complaints, encouraging slower driving through problematic corridors, or creating safer school zones, knowing exactly which areas of your city are most affected by speeding empowers you to take the proper enforcement actions exactly when and where you need to.
There are a variety of ways to collect traffic data, including researchers standing on the street corner manually counting cars, old-fashioned “tube across the road” pneumatic traffic counters, Bluetooth traffic counters, and video analytics. We believe that non-intrusive radar is the best, and it is certainly the easiest!
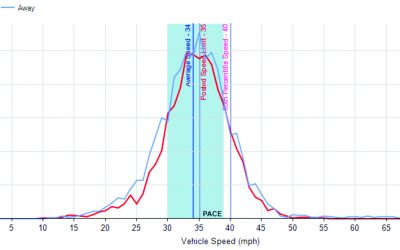
Utilizing radar traffic data (which all our speed trailers, pole-mounted graphic signs, and our traffic data collector gather with no monthly data collection fees) can give you detailed information about the volume of cars, exact data about their speed, vehicle classification, and even details about driver behavior while approaching your sign vs. while traveling through the tracking zone.
WHAT areas of our city need the most attention while planning this year’s road infrastructure projects? And what kinds of road safety projects are needed there?
By measuring changes in traffic type and volume you will have a better idea of what infrastructure needs your city will have to focus on during your next budget cycle. The only way to confirm visual observations and anecdotal evidence, however, is to go out and measure real-time information from your city streets.
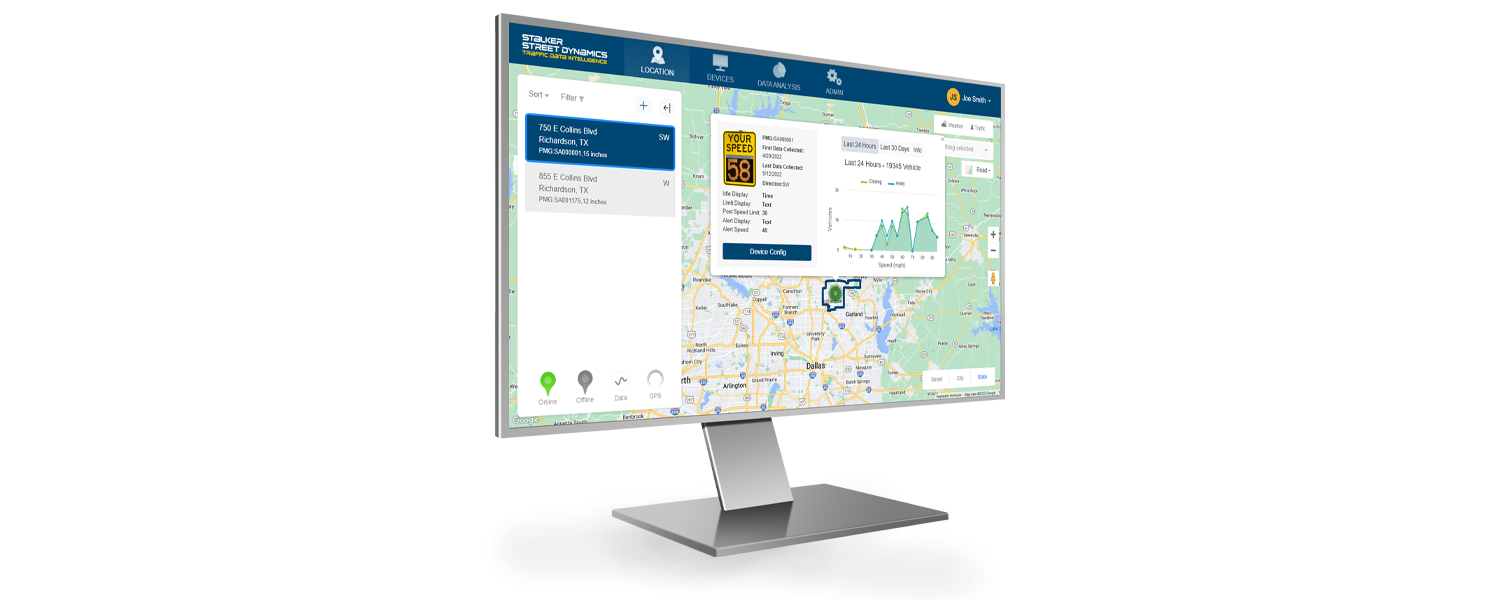
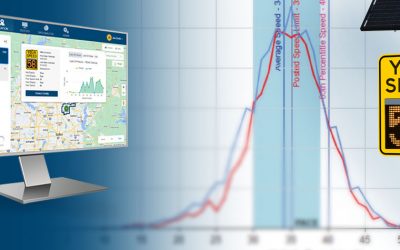
Fortunately, Stalker’s speed trailers, PMG signs, and traffic data collectors all collect traffic data that you can easily retrieve and examine in our Easy Analyst software. Quickly generate clear, easy-to-use reports so you can base your important infrastructure decisions off the most accurate data.
WHERE Are people driving at safe speeds near our parks and school zones?
Knowing if people are speeding in “slow zones” such as around schools, parks, and areas where children are present can inform decisions about allocating traffic enforcement officers, installing traffic calming solutions, or putting up additional signage or indicators in these areas.
Our radar speed trailers and pole-mounted graphic signs can be programmed to show different messages at different times of day or days of the week, so you can set up slower traffic patterns when school is in session, lower the speed limit around a park if there is a big event, or flash “TOO FAST!” or sad-face emojis at drivers if they exceed the speed limit.

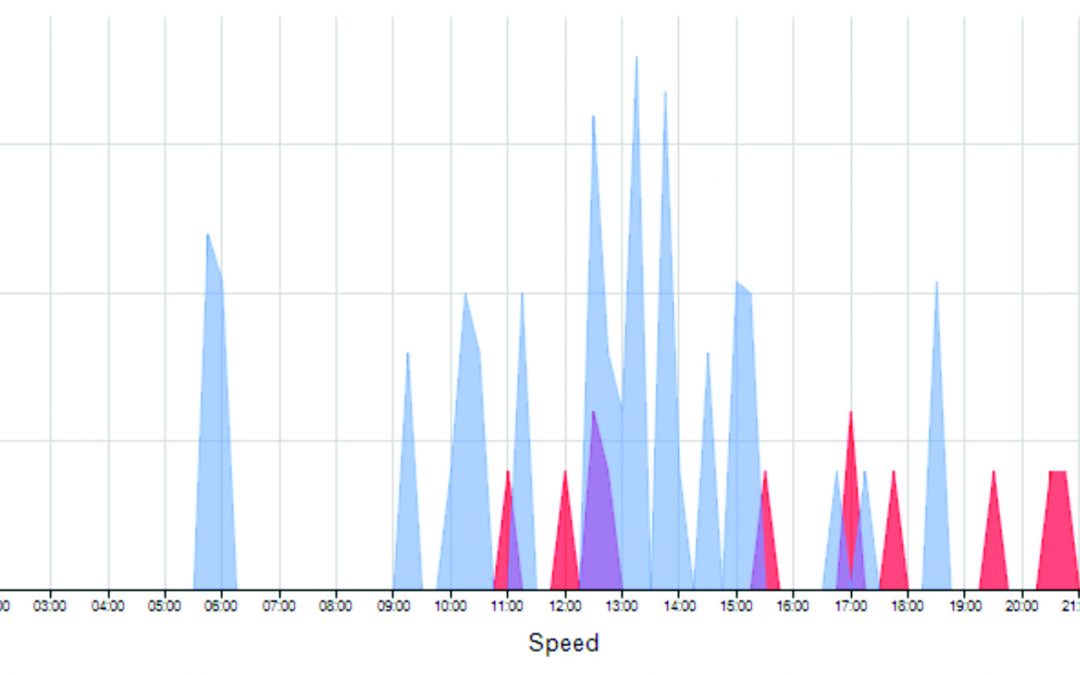
WHEN is the best time and day of the week to send speed enforcement officers to this location?
Every law enforcement department wants to use their resources in the most effective, efficient way possible. If you knew the times and days of the week when people were speeding the most, it would be easy to schedule your officers to be present in the area to slow down traffic and increase safety in your city.
You can easily get this information from the reports you run in our Easy Analyst Software. You will be able to spot traffic patterns and can even observe the exact times when people are excessively speeding (as opposed to just going a few miles over the speed limit).
WHY are people speeding more in this area?
There are many different factors that affect people’s tendencies to drive faster than the speed limit, but ultimately, people speed because there is a lack of incentive not to.
By analyzing the traffic patterns on various roads in your city, you will be able to see where your traffic enforcement efforts need to be concentrated. You’ll have a much clearer idea about whether a “hardware solution” (speed signs or traffic trailers) or “software solution” (more police presence in the area) is the best solution.
Finally, thanks to the detailed reports you can generate with the Easy Analyst software, you’ll have the information you need to know exactly where to position your resources to achieve maximum results.
It can be overwhelming to figure out the perfect traffic enforcement solutions. Would a flashing “your speed” sign be the best option for a particular intersection, or do you need something larger, like a radar-equipped variable message trailer, to capture drivers’ attention? What if you have a limited budget but need to create a slower, safer environment on multiple streets? Stalker Radar has been helping customers create the ideal radar speed sign packages for over 30 years. Click here to get connected to your local representative today!
Ready To Learn More About Traffic Data?
Transforming Traffic Data Into Road Safety
Unless you are content with just guessing or going with a “gut feeling” about your city’s traffic safety problems, you will need to collect high-quality data and understand how to translate it into useful, actionable information.
How To Collect Traffic Data
Long gone are the days when the best way to collect traffic data was by laying a pneumatic tube across a road. Nowadays, radar is one of the most accurate, cost effective, and reliable means of gathering the information your neighborhood or city needs.
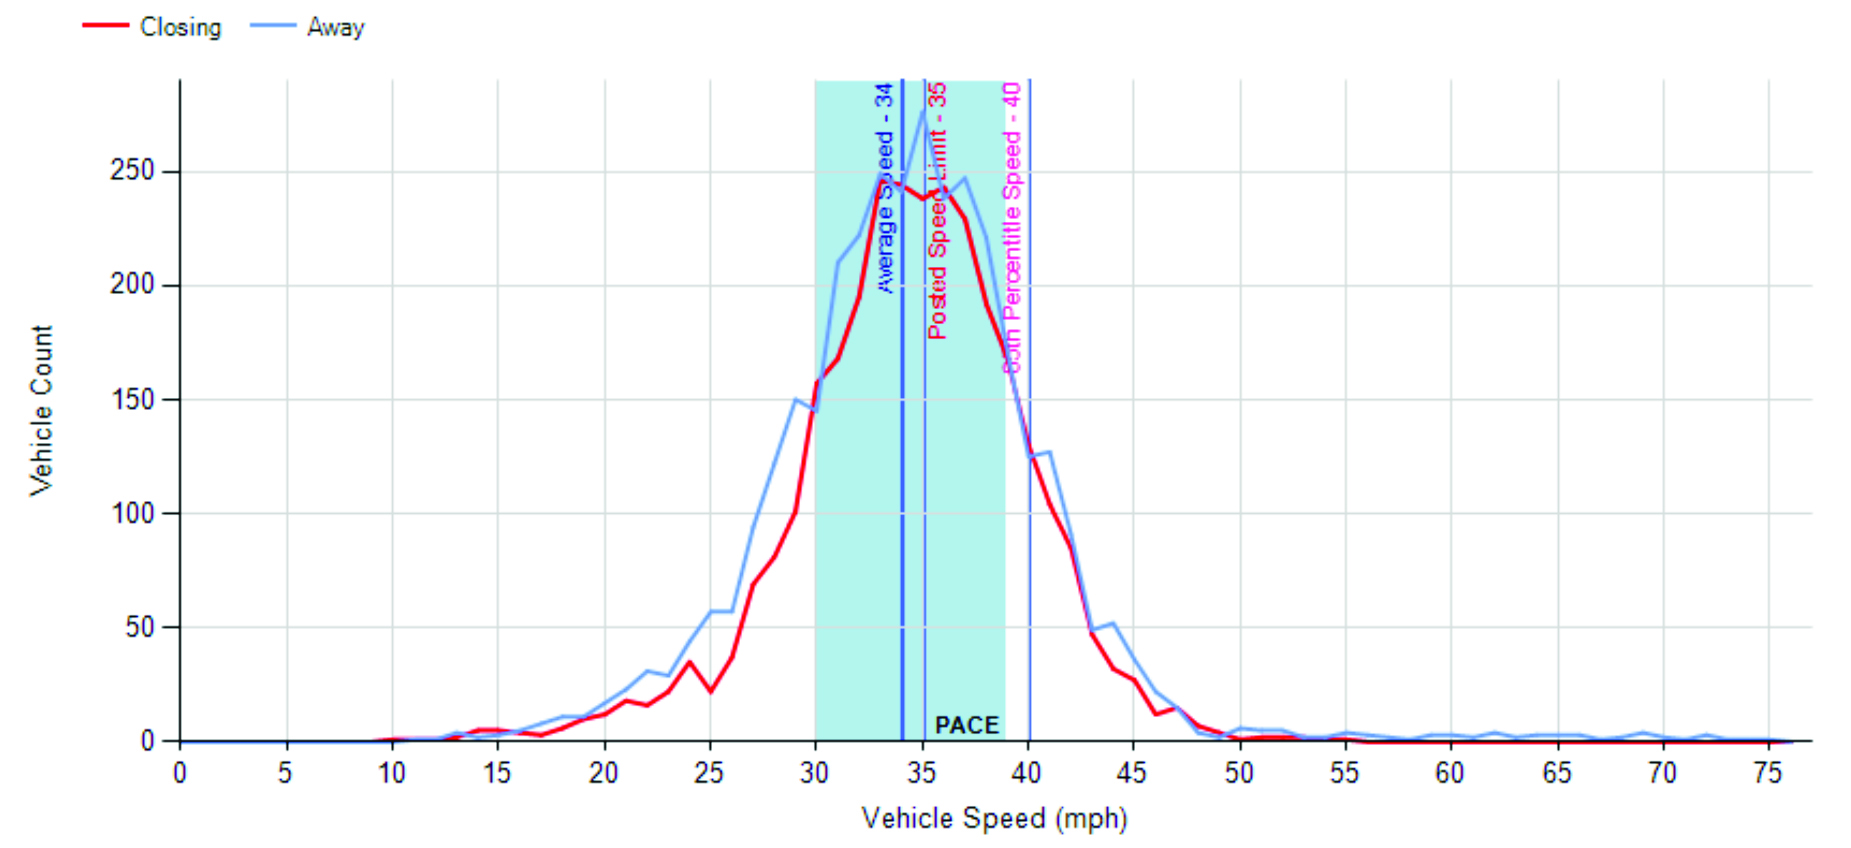
Interpreting Traffic Data Reports
Converting raw traffic data into useful, actionable information can be a bit overwhelming if you don’t know where to start. Fortunately, Street Dynamic’s Web Portal and Easy Analyst software create charts and reports from your traffic data in just a few clicks.
More Articles from Street Dynamics
Transforming Traffic Data Into Road Safety
As someone involved in creating safer streets in your community, questions like “Where should we send law enforcement officers on patrol?” “Where do we need to install new traffic calming devices?” and “How do we make the best use of our limited time and budget resources?” can be difficult to answer.
Unless you are content with just guessing or going with a “gut feeling” about your city’s traffic safety problems, you will need to collect high-quality data and understand how to translate it into useful, actionable information.
Interpreting Traffic Data Reports
Converting raw traffic data into useful, actionable information can be a bit overwhelming if you don’t know where to start. Fortunately, Street Dynamic’s Web Portal and Easy Analyst software create charts and reports from your traffic data in just a few clicks.
How To Collect Traffic Data
Long gone are the days when the best way to collect traffic data was by laying a pneumatic tube across a road. Nowadays, radar is one of the most accurate, cost effective, and reliable means of gathering the information your neighborhood or city needs.