
Interpreting Traffic Data Reports
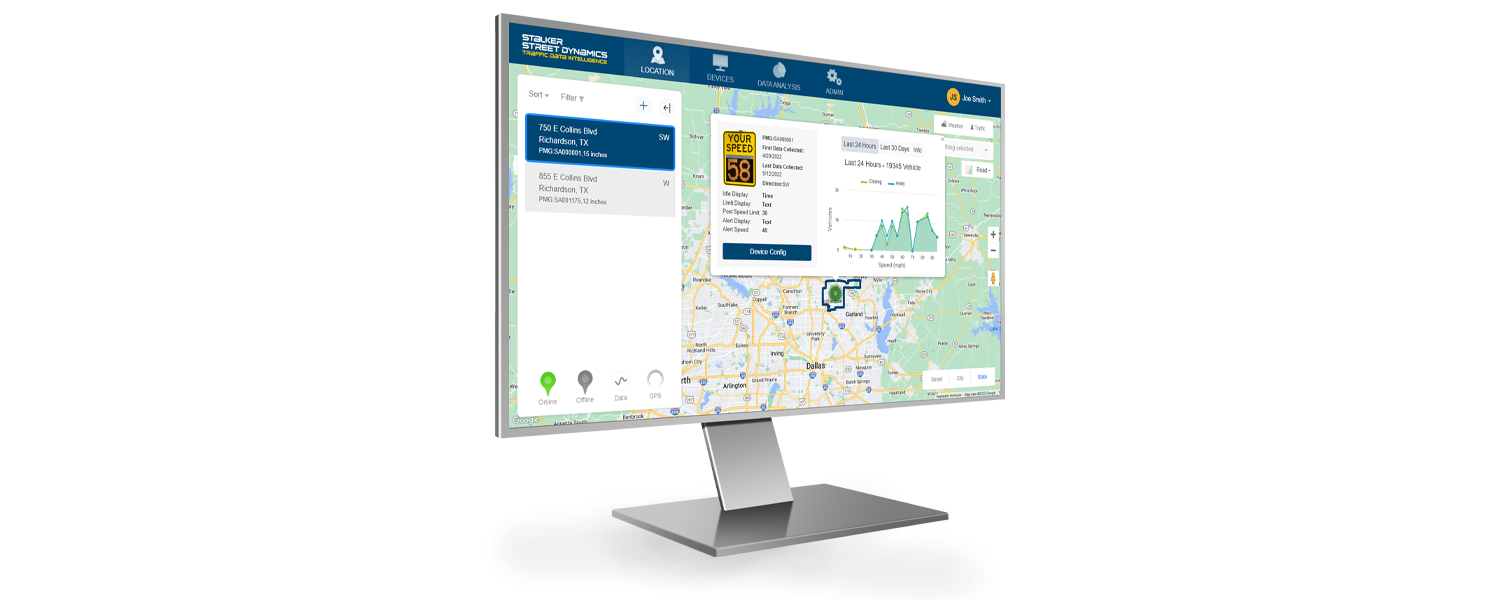
Converting raw traffic data into useful, actionable information can be a bit overwhelming if you don’t know where to start. Fortunately, Street Dynamic’s Web Portal and Easy Analyst software create charts and reports from your traffic data in just a few clicks.
Here are some of the reports that they can generate, and how you can utilize the information to create safer streets, neighborhoods, and cities.
Speed Compliance Report
This report immediately shows what percentage of vehicles are driving below, moderately above, and excessively above the speed limit during your data-gathering period.
Many departments limit traffic stops to vehicles traveling at a minimum percentage over the posted speed limit. You can define exactly what constitutes this excessive speed when creating your report, and then accurately determine if you have a problem with speeding at that location.
If you do see a problem with speeders, then utilizing some of the following reports will give you more information about the time of day and day of the week where speeding is most likely to occur, so you can direct your resources to where and when they will be most effective.


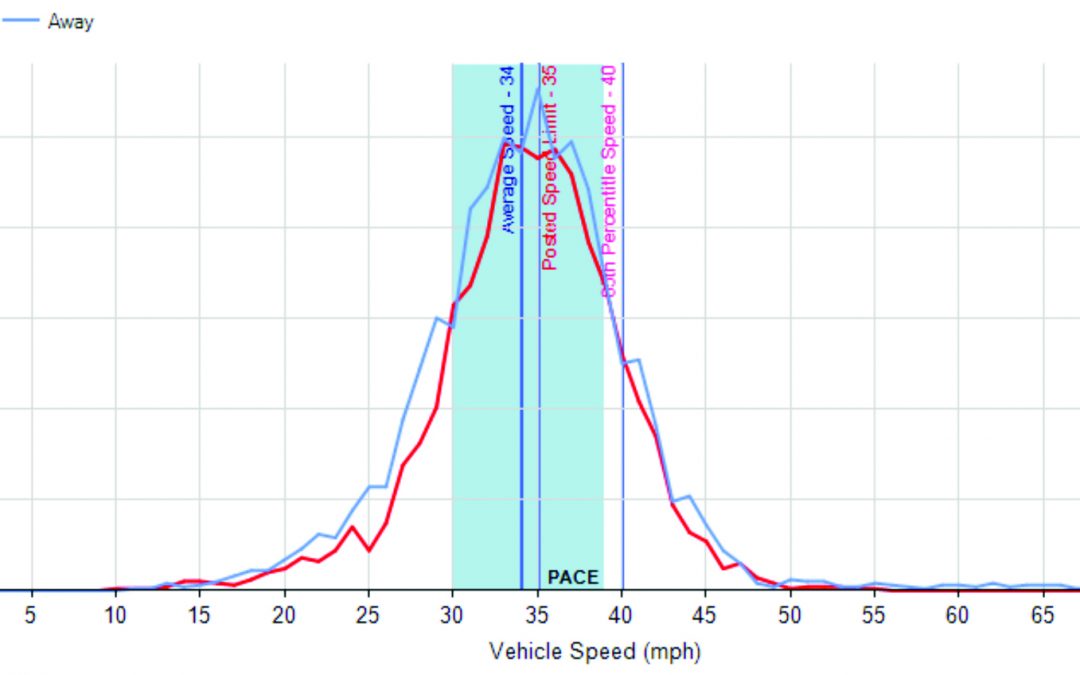
Speed Profile Report
The Speed Profile Report is a line graph version of the same data that is displayed in the Speed Compliance Report shown above.
It gives you a broader view of the distribution of vehicles across various speeds, and shows if you are having more problems with “closing” traffic (vehicles coming towards you) or “away” traffic (vehicles traveling away from you), which can help you determine on which side of the road to concentrate your speed enforcement efforts.
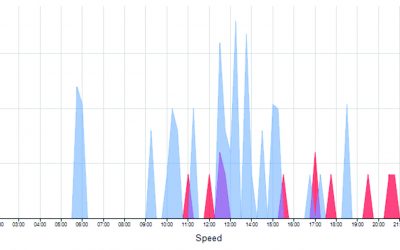
Speed Enforcement Report
This handy chart clearly provides you with the peak times for the most efficient speed enforcement efforts throughout the week.
The bars represent the number of speeding vehicles combined with a weighted representation of how much over the speed limit they were driving. This tells you at a glance when the traffic on your streets is the fastest- and therefore, the most dangerous and most in need of enforcement efforts.
You can also tailor your report to only show the data from a particular day. So, if you wanted to know a more exact timeframe for when vehicles on Friday, February 13 were speeding, you could create a report containing just that specific information – the example shown here shows that the best time to send speed enforcement officers to the scene would be on Wednesdays between 5:30-6:15 AM, and again between noon-3:30 PM.


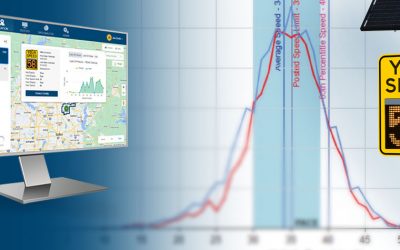
Count vs. Delta Speed Report
This graph provides you with precise data on the effectiveness of your sign. See how fast vehicles were moving as they were entering your measurement zone, and then see by how much their speed was reduced while they were traveling through the measurement tracking zone.
If you notice that speeds are not being properly reduced, ensure that drivers can easily see your sign. They may also have become desensitized to the sign over time and you need to move it to a new location, change the messaging, or consider sending out a traffic enforcement officer to that area.
There are many other available report types that can be generated by the Web Portal and the Easy Analyst software. If you would like more information about how to collect traffic data, please click here to reach out to your local Street Dynamics representative, or click here to visit our informative Traffic Data Collection page that shows you all the ways you can use Street Dynamics products to collect and process traffic data.
Ready To Learn More About Traffic Data?
Transforming Traffic Data Into Road Safety
Unless you are content with just guessing or going with a “gut feeling” about your city’s traffic safety problems, you will need to collect high-quality data and understand how to translate it into useful, actionable information.
Top 5 Questions Answered By Traffic Data
The decisions you make about traffic and infrastructure will have a decisive impact on your community’s safety and economy. By properly managing traffic, you can enhance safety, spend resources more efficiently, and make living in your city more enjoyable.
How To Collect Traffic Data
Long gone are the days when the best way to collect traffic data was by laying a pneumatic tube across a road. Nowadays, radar is one of the most accurate, cost effective, and reliable means of gathering the information your neighborhood or city needs.
More Articles from Street Dynamics
Transforming Traffic Data Into Road Safety
As someone involved in creating safer streets in your community, questions like “Where should we send law enforcement officers on patrol?” “Where do we need to install new traffic calming devices?” and “How do we make the best use of our limited time and budget resources?” can be difficult to answer.
Unless you are content with just guessing or going with a “gut feeling” about your city’s traffic safety problems, you will need to collect high-quality data and understand how to translate it into useful, actionable information.
Top 5 Questions Answered By Traffic Data
The decisions you make about traffic and infrastructure will have a decisive impact on your community’s safety and economy. By properly managing traffic, you can enhance safety, spend resources more efficiently, and make living in your city more enjoyable. Here are 5 questions answered by the traffic data you collect from your streets.
How To Collect Traffic Data
Long gone are the days when the best way to collect traffic data was by laying a pneumatic tube across a road. Nowadays, radar is one of the most accurate, cost effective, and reliable means of gathering the information your neighborhood or city needs.