Traffic Data
Collect Traffic Data for Grants, Infrastructure Projects, and Traffic Enforcement Efforts
Accurate traffic data is at the heart of all of Stalker Radar’s traffic safety products. From radar speed trailers, to pole-mounted messaging signs, to our Traffic Data Collector 2 (TDC 2), we have a traffic data collection solution to fit just about any need your municipality, law enforcement department, or home owners association may need.
Once you have collected the traffic data, use one of our two traffic data analysis tools to create full-color reports, charts, and graphs that you can use to inform your traffic safety work.
COLLECTING TRAFFIC DATA
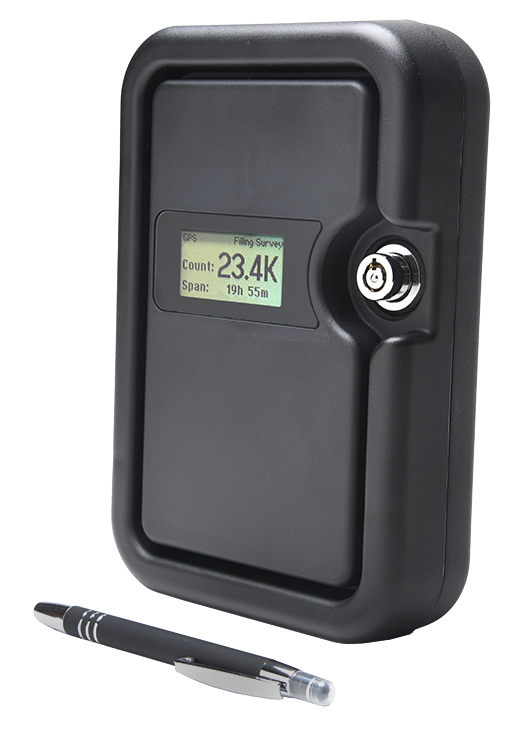
Traffic Data Collector 2
The Street Dynamics Traffic Data Collector 2 (TDC 2) gives you powerful radar traffic data collection packaged in a small, discreet pole-mounted case that is rarely noticed by passing motorists.
Don’t waste time or money renting contracted data collection services when you can own both your data and the data collecting unit.
It is rare for a city to have just one street with speeding problems. The TDC 2 can be easily relocated, and in just a few minutes, you’ll be collecting a more well-rounded data set to make the best decisions for keeping your community safe.
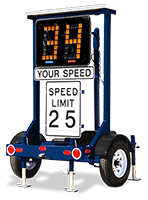
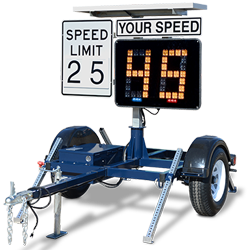
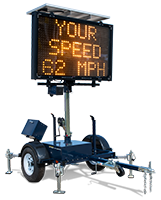
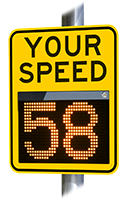
Speed and Message Signs
All Street Dynamics Radar Speed Signs, Message Signs, and Speed Trailers are offered with the ability to collect traffic data.
ANALYZING TRAFFIC DATA
Collecting traffic data is only the first step to understanding how to create safer streets in your community. The next step is converting that raw data into useful, actionable information.
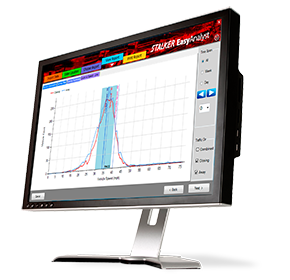
We offer two software options that can help you turn your traffic data into full-color reports, charts, and graphs: The Street Dynamics Web Portal and the Easy Analyst Desktop software.
These programs make it easy for law enforcement, municipalities, HOAs, grant-funding organizations, and other stakeholders to make well-informed decisions so they can best serve their residents.
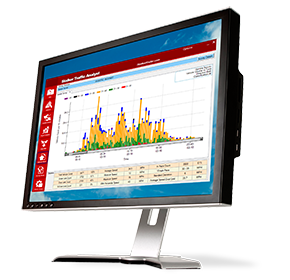
Street Dynamics Web Portal
Traffic data analysis is just one of the many great features offered by the Street Dynamics Web Portal. You can access the data collected by any of your connected PMG radar speed and messaging signs, and, in just a few clicks, can turn it into detailed, full-color reports, charts, and graphs.
In addition, the Web Portal also allows you to interact with all the other components of your PMG. You can create new messages and schedule them to appear on your sign days or even years in advance. And you can do it all right from the comfort of your desk, anywhere in the world.
Easy Analyst Software
Easy Analyst allows you to upload traffic data from any of our radar speed signs, message signs, and speed trailers that are equipped with a traffic statistics package.
Simply download the traffic data from your sign via a USB flash drive, upload it onto your computer, then simply select your desired reports and graphs from the list of 19 useful options. You can analyze what days and times people speed most frequently, the count and classification of the vehicles on the road, the 85th percentile speeds, and so much more.
Traffic Analyst Software
Traffic Analyst allows for more in-depth data analysis. Updated analysis controls allow the user to take raw data and display it by count vs time, count vs speed, and 85th percentile, just to name a few. Data can be split, graphed, filtered, and then rendered in a color report designed with Agency Branding and support information.
Beginning with the setup, intuitive survey management tools walk the user through calendar setup, location details, speed and time resolutions, vehicle classification, speeds, distances, as well as sensor setup.
What can you do with Traffic Data?
Traffic data is critical for understanding how traffic flows throughout your city and which areas have the most safety concerns due to speeding vehicles. Our traffic data collectors and speed and messaging signs collect several important datapoints, including:
Vehicle Speeds
We record the speed, time, and date of all vehicles that pass your sign or traffic data collector. You can see what times and days of the week have the highest incidence of speeding, so you can time your enforcement efforts most efficiently.
85th Percentile Data
Many states mandate that speed limits reflect the 85th percentile speeds on that road. All of our software tools, including the Street Dynamics Web Portal and the Easy Analyst Software options, are able to take your Street Dynamics data and provide these reports.
Vehicle Classification
Now you can understand the types of vehicles that are using your streets, including their speed, time, and date. This helps inform your city’s transportation decisions, such as whether or not you need to widen roads, create safer truck routes, or add bike lanes.
Once you have collected a statistically significant amount of traffic data, you can mine the data for trends, patterns, and other useful information. All of our traffic data packages include access to the Easy Analyst Reporting Software, and the PMG radar speed and messaging sign can also be used with our Street Dynamics Web Portal.
What Kinds of Reports and Charts Do You Offer?
Both Street Dynamics and Easy Analyst offer over a dozen different report and chart options. They can be mixed and matched to create highly informative reports that can be downloaded as PDFs or emailed to stakeholders.
Customer favorites include the Speed Profile Report, the Traffic Volume Report, and the Speed vs. Volume Matrix.
Traffic Data Collection Regulations + Privacy Concerns
Unlike systems that use cameras, RFID tags, or ALPR (automatic license plate recognition), there are no privacy concerns with any Street Dynamics radar-collected traffic data. The collected data is simply a record of speed + date + time, so there is never a need to anonymize the data or remove any personally identifiable information from your records.

