Easy Analyst Software
Full-Color, Data-Rich Reports in Just a Few Clicks
All of Street Dynamic’s radar-equipped speed signs and trailers, in addition to the Traffic Data Collector, come with the ability to collect data about vehicle speeds, traffic flow, vehicle classifications, and more.
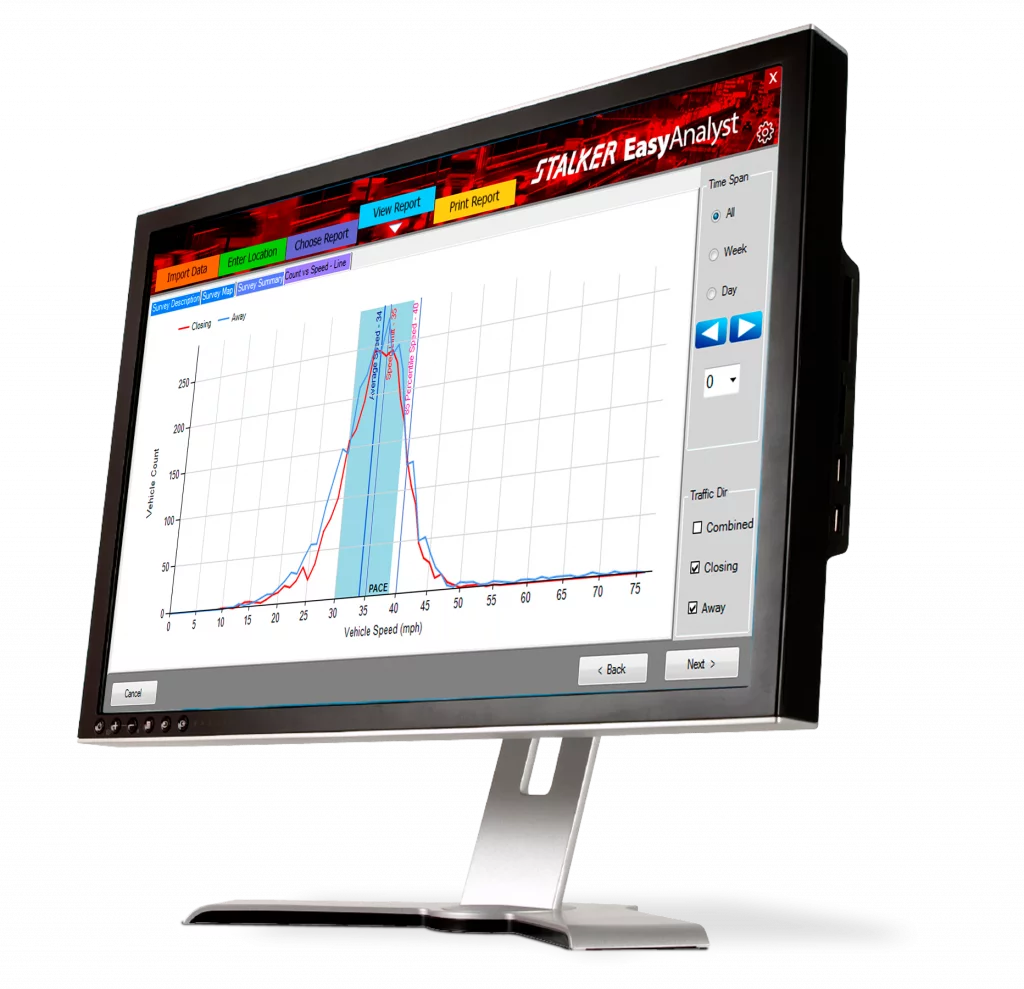
With Easy Analyst, you can transform this data into beautiful reports, charts, and graphics that can be used by for law enforcement agencies, city planning agencies, HOAs, school districts, and other stakeholders. These reports are also formatted to be useful during the grant application process.
Easy and intuitive enough for anyone to start using it immediately, Easy Analyst provides a depth of information that can be used to address just about any traffic concern your neighborhood, city, or agency is facing.

Turn Your Traffic Data into Useful Reports for Grant Applications, City Councils, and Department Use With Easy Analyst Software.
The very first step of the grant application process is to define the need. Whether for adjusting a speed limit, purchasing a speed/message sign, or allocating department resources, properly assembled traffic data can make all the difference between a winning or losing application.
Powerful traffic statistic tools are essential when analyzing aggregate data. Once you’ve decided on your favorite report style, you can save it as a template for future use.
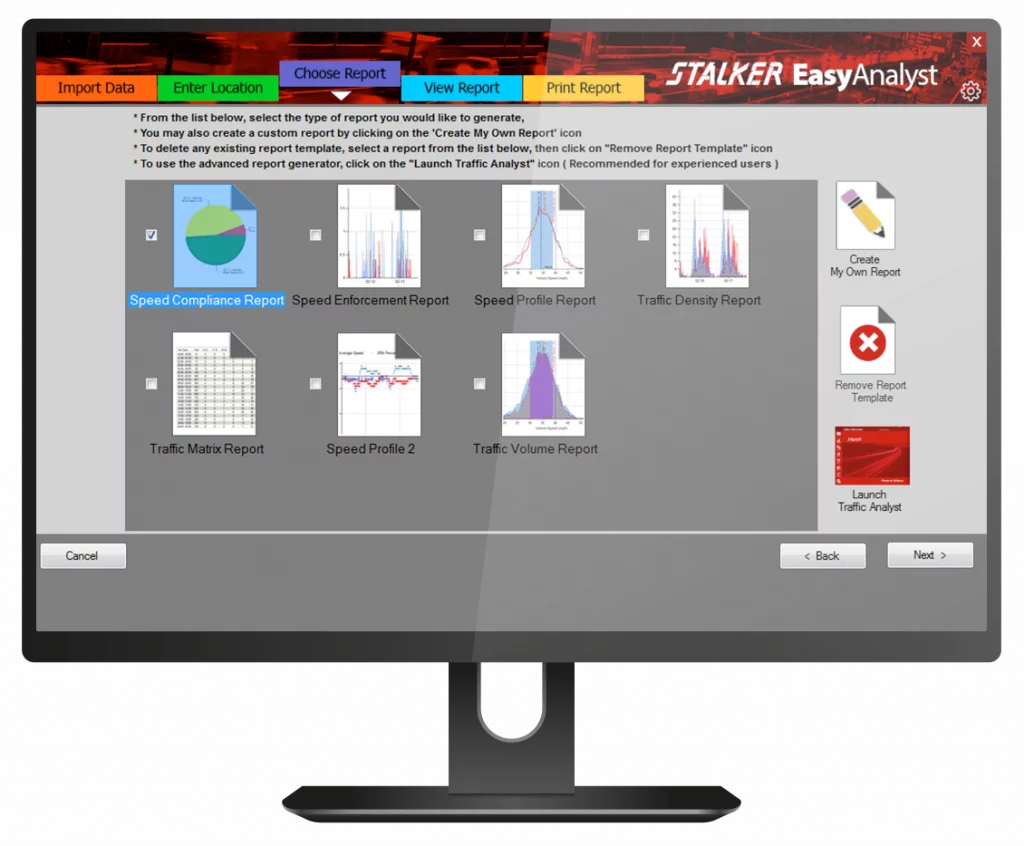
Available Easy Analyst Traffic Data Reports

- Speed Compliance Report
- Speed Enforcement Report
- Traffic Volume Report
- Speed Profile Report
- Traffic Density Report
- Traffic Matrix Report
- Speed vs. Time bubble
- Survey Description
- Survey map
- Count vs. Delta Speed
Export your report as a .PDF file with images

- Survey Summary
- Count vs. Time
- Count vs. Speed
- Average Speed vs. Time
- Daily Vehicle Count
- Speed Volume Matrix
- Speed Percentile
- Violation Rate
- Enforcement Schedule
Export your report as an Excel file

Traffic Analyst Software
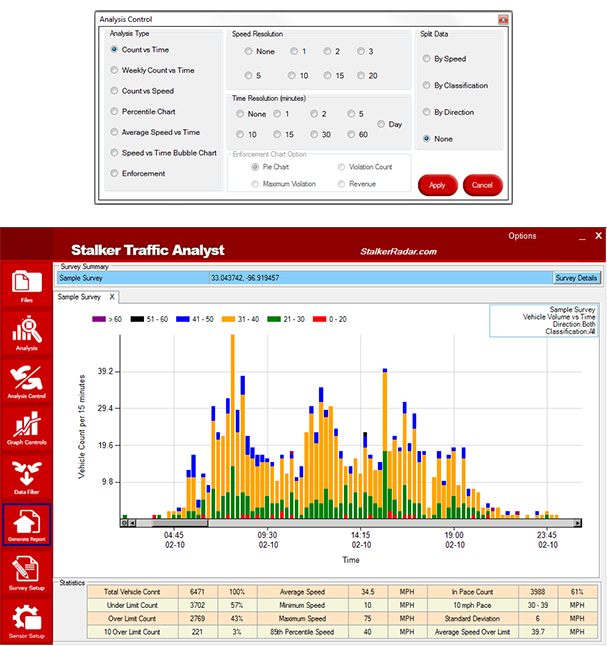
Traffic Analyst allows for more in-depth data analysis.
Compare and toggle between multiple reports, and group file operations into project folder.
The floating palettes control the visual display and survey details may be added such as Google Map/satellite views, descriptions, and notes.
Analysis Control
The Analysis Control palette where the analysis type is chosen and then applied to the analysis window.
Graphic Controls
The Graphic Controls palette provides additional options such as grid detail, data values, display type (graph or tabular) and graph type.
Data Filtering
Fine tune the data by more selective parameters such speed, dates, times, classification, and traffic direction.
Simple Sensor Setup
Communication between the Traffic Analyst program and the Stalker Traffic Statistics sensor is simple and virtually automatic.

